

Week 13: what the numbers are for
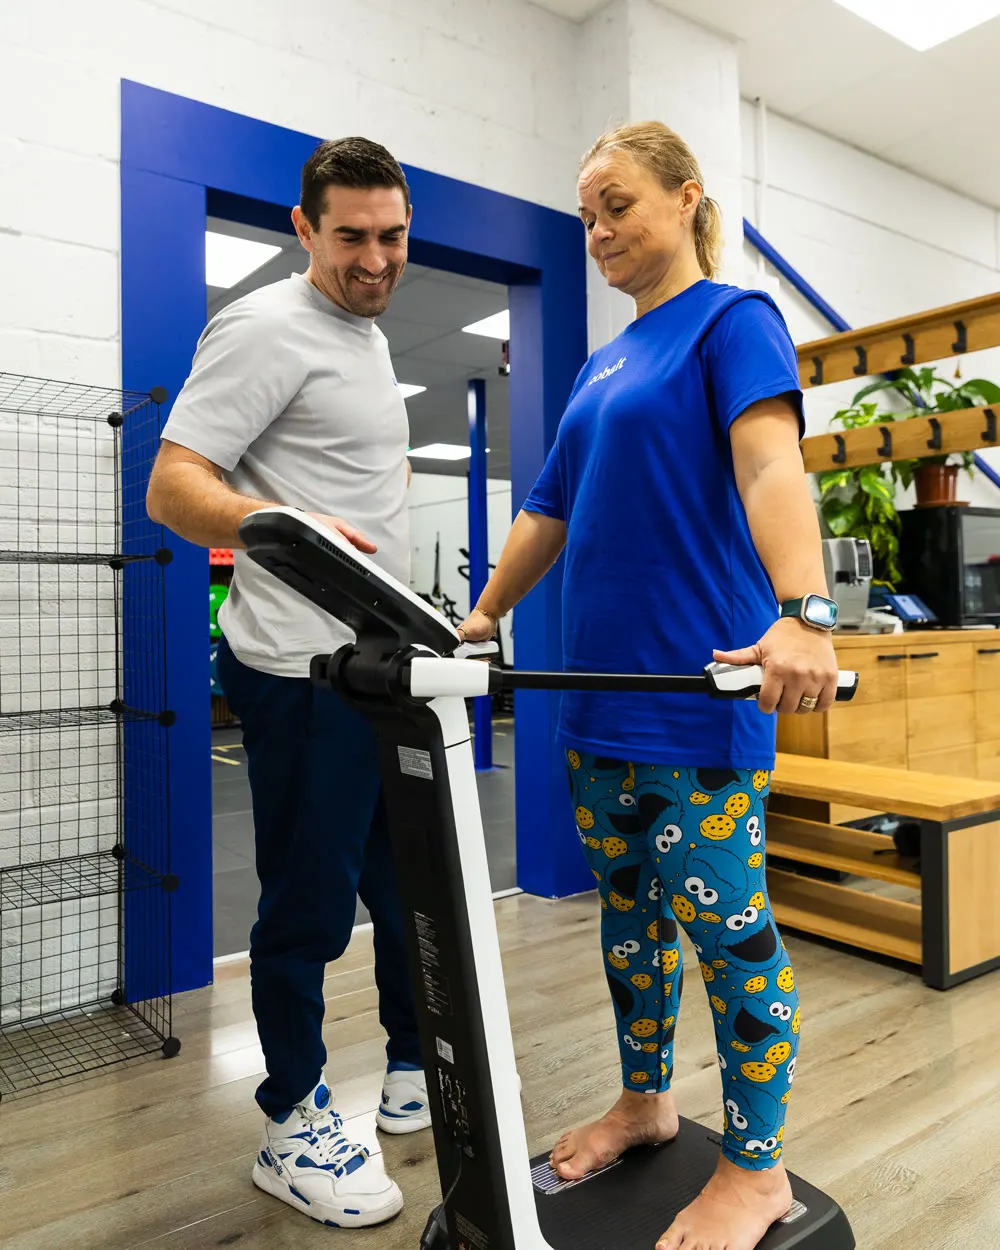
When we started the process of creating Cobalt one of the most important principles on which we wanted to be judged is our ability to make fitness matter. Not in the gym, but away from it.
‘The biggest benefits of training are not measured in the gym. They’re felt in everything beyond it.’
The work you do with us is designed to help build and maintain physical freedom so you can continue to do the things you love for longer. Now this is easy to say, and subjectively I am sure you have all felt the benefits, but we wanted to be able to show you this in a more objective way.
We want to show you how your progress in the gym in terms of numbers impacts your health and longevity relative to the science. Much like InBody does with your body composition and VALD with your joint movement.
By doing this we aim to achieve a few things.
- Identify simple areas you can work on to get the most out of your training.
- Help you see the progress you are making and understand the impact your training has on your life.
- Give you more specific numbers to work toward in your sessions.
By introducing these ideas, and helping you understand why we do what we do, we believe we can make your gym experience a more rewarding one.
The impact we do not want this to have.
Is to make you feel you are not doing enough. The last thing we want is for you to feel like you are falling short, because you are not. You are further ahead than you think and even if your progress doesn’t match the numbers - you are doing just fine.
If there is any danger of this demotivating you or being counterproductive to your enjoyment then please just ignore the numbers and continue to enjoy your sessions.
If the numbers are not for you we would encourage you to stay focussed in 2 areas.
1/ achieve a minimum of 1300 MyZone MEPs per month
2/ Strength train twice per week every week.
By achieving this you are putting yourself way ahead of your peers and ensuring you have the basic requirements for fitness and strength covered. Helping you to look after your body so it will look after you in the future. - If this is you, there is no need to read on.
If you’d like to have some figures to aim for or to enable your training to be more specific, read on.
The basics.
Obviously it would be impossible to create an individual set of numbers for every Cobalt member so we focussed on what was important. The way we see it is that if you can maintain or supersede the levels of an average weight 50-55yr old individual you are doing pretty well.
We have created 3 levels for you to consider.
Base numbers. By achieving these you are out of the danger zone and clear of the highest risk groups, and you are fitter and stronger than 3 in 10 average 50 year olds. Our first goal at Cobalt is to make sure anyone regardless of age can achieve these numbers.
Intermediate numbers. Achieving these is a good indication you are ‘fit’ and ‘strong’ versus the average 50 year old and would be in the top 40%. These numbers are worth understanding and progressing towards during your time with us. By doing this you will really feel the difference in your life away from the gym.
Advanced numbers. These are purposefully hard to achieve and put you in the top 20% of the fittest 50 year olds around. Even being able to achieve 1 or 2 of these numbers is a great effort. Do not judge yourself on these but do strive for them where you can.
The thinking on this is simple.
If you are younger than the avatar figures. The intermediate and advanced give you a target to work towards to ensure your physical freedom does not become limited as you age.
If you are older than the avatar, making sure you above the base levels is important, then by improving your figures and moving closer to the intermediate levels you are actively reducing your physical age.
Numbers are based on 50-55 years man at 85kg, and woman at 70kg.
Caveats…
A couple of caveats before we share the figures.
- All the figures are based on all out efforts. 10/10 effort. Nothing left in the tank. When comparing your scores to the representative number bear this in mind, checking your perceived effort at the end. Could you have given more? This is not to say we demand all out effort - we don’t. It is just that if you worked 8/10 hard you are probably closer to the standard than you think.
- Reaching the base level with 7/10 effort is good; The intermediate level is going to require a little more work; Achieving the advanced level is unlikely to happen unless you are all in.
- Your exercise experience matters. The less experience you have with an exercise the harder it will be.
- Consistency is more important than intensity, so if pushing too hard is likely to make you less consistent, it’s not worth the payoff.
Only ever work to a level you feel comfortable with, you can always push a little more next time. When it comes to strength exercises, how you lift is more important than how much so let the coach guide on how much as you progress.
The Figures - Longevity
VO2 max - This is your fitness level or how much oxygen you can use per minute and is strongly correlated with how long you are likely to live. For every 1 unit improvement your life expectancy increases 45 days.
| VO2 max (ml/kg/min) | Base | Intermediate | Advanced |
|---|---|---|---|
| Men | 28 | 34 | 40 |
| Women | 20 | 25 | 30 |
Grip strength - Is the physical capability most closely linked with longevity and has been shown to predict early death better than blood pressure. How long you live and how much you get to enjoy it could be dependent on how strong your grip is. Why? Well, grip strength is closely linked with the overall strength of the body. If you cannot hold onto a weight you cannot move it, so those with the strongest grips are often those with the best strength to weight ratios overall.
| Carry, 30 seconds (total weight) | Base | Intermediate | Advanced |
|---|---|---|---|
| Men | 0.5 × bodyweight | 1.0 × bodyweight | 1.5 × bodyweight |
| Women | 0.4 × bodyweight | 0.8 × bodyweight | 1.2 × bodyweight |
These figures are related to total weight. 1.0 x bodyweight = 0.5 x bw in each hand
The Figures - Cardiovascular
Discovering your true VO2 requires a full lab. We don’t have that, so have come up with a few tests in which the outcomes can be relative to each of the levels.
| Test | Group | Base | Intermediate | Advanced |
|---|---|---|---|---|
| 6-minute walk | Men | 450 m | 550 m | 650 m |
| Women | 400 m | 500 m | 600 m | |
| 12-minute run | Men | 1,500 m | 1,750 m | 2,000 m |
| Women | 1,250 m | 1,425 m | 1,600 m | |
| 2k row | Men | 9:20 (2:20 /500m) | 8:40 (2:10) | 8:00 (2:00) |
| Women | 10:00 (2:30 /500m) | 9:20 (2:20) | 8:40 (2:10) | |
| 4-minute bike (average watts per kg) | Men | 2.0 | 2.75 | 3.5 |
| Women | 1.5 | 2.0 | 2.5 |
| 30-minute bike (average watts per kg) | Base | Intermediate | Advanced |
|---|---|---|---|
| Men | 1.5 | 2.0 | 2.5 |
| Women | 1.0 | 1.5 | 2.0 |
The Figures - Bodyweight Base
| Exercise | Target | Base | Intermediate | Advanced |
|---|---|---|---|---|
| Hip Bridge | 60 sec | Bodyweight | Sliders | Banded sliders |
| Lateral Core | 45 sec | Knee bent | Straight arm/leg | Copenhagen |
| Plank | 45 sec | Box | Straight arm | Gymnastic |
| Lateral Hip Thrust | 20 reps | Level 1 | Level 2 | Level 3 |
| Inverted Row | Everyone | 45° × 15 | Foot to wall × 10 | Feet raised × 10 |
| Grip Hang | Women, 90 sec | 45° inverted hang | Inverted hang | Dead hang |
| Men, 120 sec | 45° inverted hang | Inverted hang | Dead hang | |
| Press Up | Women | Bar × 20 | Bench × 10 | Floor × 5 |
| Men | Bench × 20 | Floor × 10 | Floor × 20 | |
| Pull Ups/Chins | Women | Eccentric | 1 rep | 5 reps |
| Men | 1 rep | 5 reps | 10 reps |
The Figures - Basic Strength
| Exercise | Group | Base | Intermediate | Advanced |
|---|---|---|---|---|
| Split Squat | Everyone | Assisted × 15 | Bodyweight × 10 | Bodyweight × 20 |
| Single Arm Press | Women | 4 kg × 15 | 8 kg × 10 | 16 kg × 5 |
| Men | 8 kg × 15 | 16 kg × 10 | 28 kg × 5 | |
| Single Arm Pulldown | Women | 0.2 bw × 15 | 0.4 bw × 10 | 0.6 bw × 5 |
| Men | 0.25 bw × 15 | 0.5 bw × 10 | 0.75 bw × 5 | |
| Goblet Squat, 25 reps | Women | No weight | 0.2 bw | 0.4 bw |
| Men | No weight | 0.25 bw | 0.5 bw | |
| DB Bench Press | Women | 7.5 kg × 10 | 12.5 kg × 8 | 17.5 kg × 5 |
| Men | 20 kg × 10 | 27.5 kg × 8 | 35 kg × 5 | |
| KB/Hybrid Deadlift | Women | 0.25 bw × 15 | 0.5 bw × 10 | 0.75 bw × 5 |
| Men | 0.5 bw × 15 | 0.75 bw × 10 | 1.0 bw × 5 |
By achieving base to intermediate in all the areas above you can be sure your health and fitness is in a good place. The figures below are a step up and help you see where your overall strength levels are beyond the basics.
The Figures - Compound Strength [5 rep max]
| Exercise | Group | Base | Intermediate | Advanced |
|---|---|---|---|---|
| Prone Row | Women | 0.3 bw | 0.5 bw | 0.7 bw |
| Men | 0.5 bw | 0.75 bw | 1.0 bw | |
| Bench Press | Women | 0.3 bw | 0.5 bw | 0.7 bw |
| Men | 0.5 bw | 0.75 bw | 1.0 bw | |
| Split Squat | Women | 0.2 bw | 0.4 bw | 0.6 bw |
| Men | 0.3 bw | 0.5 bw | 0.7 bw | |
| Romanian Deadlift | Women | 0.5 bw | 0.75 bw | 1.0 bw |
| Men | 0.75 bw | 1.0 bw | 1.25 bw | |
| Squat | Women | 0.5 bw | 0.75 bw | 1.0 bw |
| Men | 0.75 bw | 1.0 bw | 1.25 bw | |
| Trap Bar Deadlift | Women | 0.75 bw | 1.0 bw | 1.25 bw |
| Men | 1.0 bw | 1.25 bw | 1.5 bw |
In order to work out your estimated 1RM you can use the below formula.
W ( 1 + r/30) = 1RM. W= weight; r= reps